How-to guides: all pages
How to see what is straining your Mac
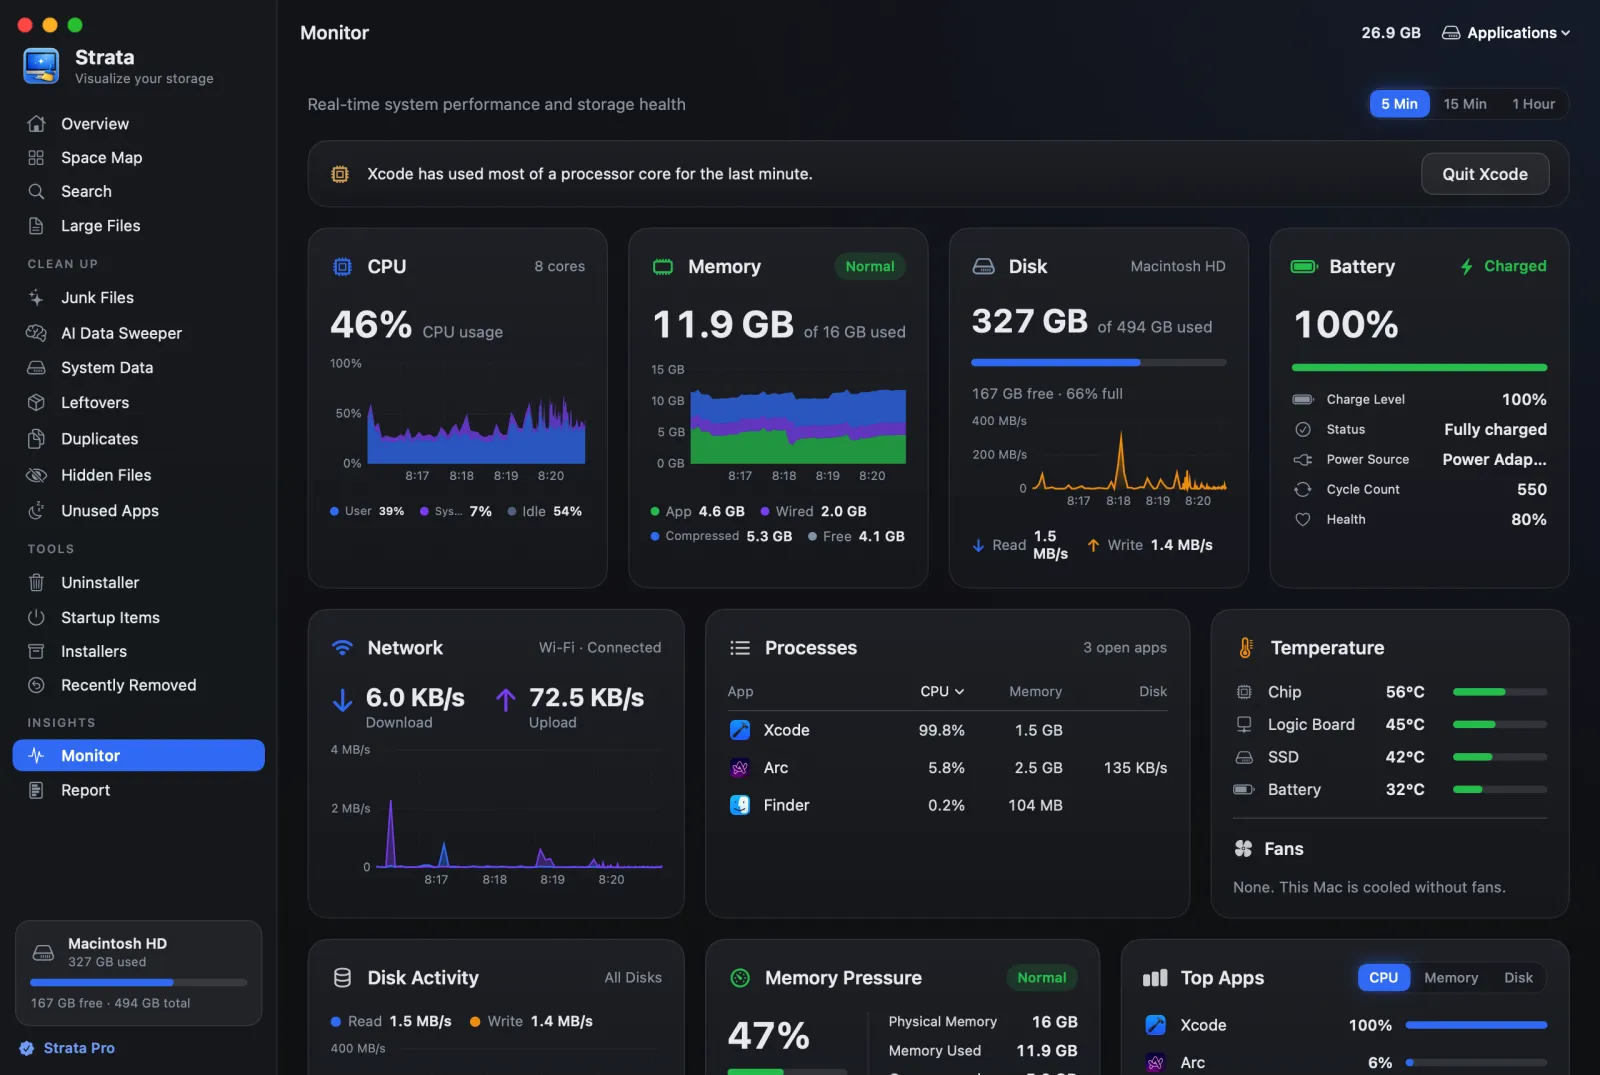
When the Mac feels slow, open Strata's Monitor and give it a minute. From 1.0.40, a line at the top names what is straining the Mac, if it is memory pressure, growing swap, fast disk writes or a busy app. Its button quits the app it names, or opens Activity Monitor.
What you need
- Strata 1.0.40 or later. The Monitor is free. Its line uses only readings taken while the Monitor is on screen with Strata in front.
Steps
-
Open the Monitor
Click Monitor, under Insights in Strata's sidebar. Clicking a notice that free space is falling fast opens it as well.
-
Keep it in front for a minute
The line judges a whole minute of readings, so a brief spike never sets it off; memory pressure needs ten seconds. The Monitor stops reading for the line while another app is in front or its window is covered, so stay on it. The line comes about a minute after you open it, or after you come back to it.
-
Read the line
Only the most pressing problem shows. When the Mac is fine in all four ways below, there is no line at all. No line, and the Mac still slow? Sort the Processes card by processor, memory or disk, or click it for every open app, each with a Quit button.
-
Decide what to do
If the line names an app you can spare, press its button, Quit followed by the app's name (Quit Safari, say). Strata asks the app to quit as Command Q would, so one with unsaved work can ask you first, and quitting a part of macOS takes a second press. When the line names no app, its button is Open Activity Monitor instead, which shows every process, the system's own included. Rest the pointer on the line first: it holds still, so the button stays put.
What the line says, and what to try
| The line starts | What it means | What to try |
|---|---|---|
| Memory is under pressure. | macOS is short of memory, and has been for ten seconds or more. | Quit the app the line names, if you can spare it. With no app named, look in Activity Monitor's Memory tab. |
| Swap is at … and growing | macOS is moving memory out to the disk, a quarter of the Mac's memory or more so far. | The same: close what you can spare, starting with the app it names. |
| The disk has been written at … | Something has written 30 MB a second or more for a minute, and the open apps account for little of it. | Open Activity Monitor, choose View > All Processes, and sort its Disk tab. |
| An app's name, then has used … for the last minute | That app has kept most of a processor core busy, or more, for a minute. | Quit it if it should be idle. Leave it if it is working for you, on an export or a build. |

The line names what an app has taken, not that it is to blame: a busy app may be doing exactly what you asked of it.
The Monitor's documentation covers the charts and cards under the line. With Strata Pro, or during the trial, Optimize frees memory and closes idle apps in one step.